Workbench
The workbench is a Dymola-style modeling and simulation environment that runs in the
browser. The compiler and solvers are the same Rust code as the command line, compiled to
WebAssembly (a compact format that browsers run at close to native speed) and run in a Web
Worker (a background thread, so the page stays responsive while a model
translates or simulates). Simulation in the page or via daedalus serve stays on the
machine; ✦ Assistant sends the text it reads and the numbers it asks for to OpenRouter, and to the provider of the selected model.
Layout
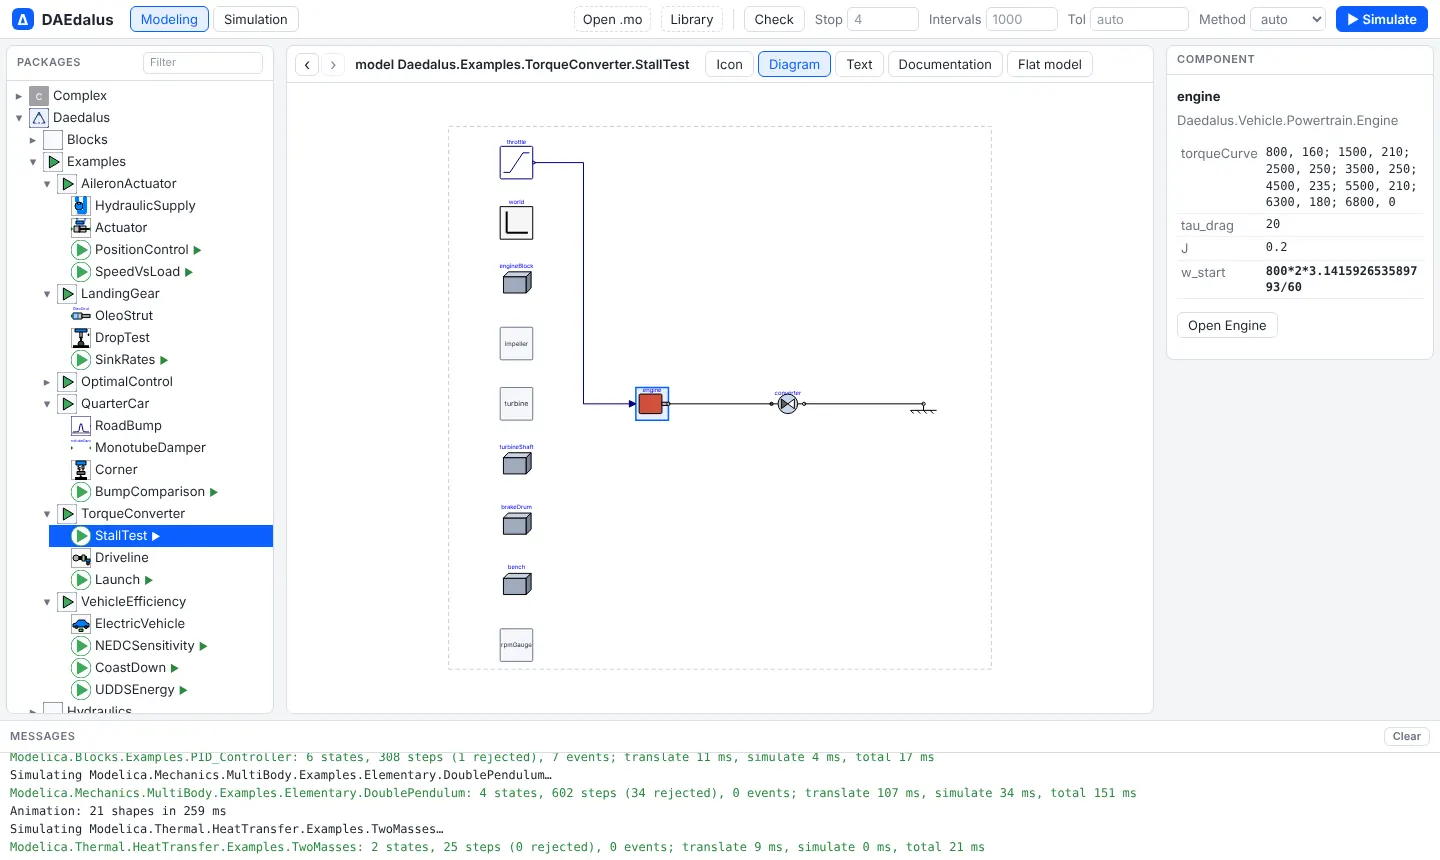
- Toolbar. Google and GitHub sign in. A button appears once the site has that
provider's client id. GitHub's code exchange runs on the hosted site's server, so the client
secret is never in the page. Modeling, Simulation and Analysis switch modes. Open,
Folder and Libraries load your own files, a library folder, or a package from
the index. Save .zip downloads the open model with the files and resources it needs.
Check translates the model and reports its statistics. Stop, Intervals,
Tol and Method override the model's
experimentannotation for the next run, and ▶ Simulate (Ctrl+Enter) runs it. On a narrow window, More holds Open, Folder, Libraries, Save .zip and those experiment fields. - Packages (left). Every loaded library:
Daedalus, the MSL (Modelica,ModelicaServices,Complex) and whatever you opened. Models with a ▶ can be simulated. The filter box narrows the tree to matching classes. On a phone the pane starts collapsed behind its title, so the diagram is the first screen. - Class views (centre). The open class in one of eight views — Icon, Diagram, Text, Documentation, Flat model, Structure, Linear and Diff — with Back and Forward arrows next to its name.
- Component (right). Click a component in the diagram to see its class, description and parameter values; Open jumps to that class.
- Messages (bottom). Translation statistics, timings, warnings and errors.
Class views
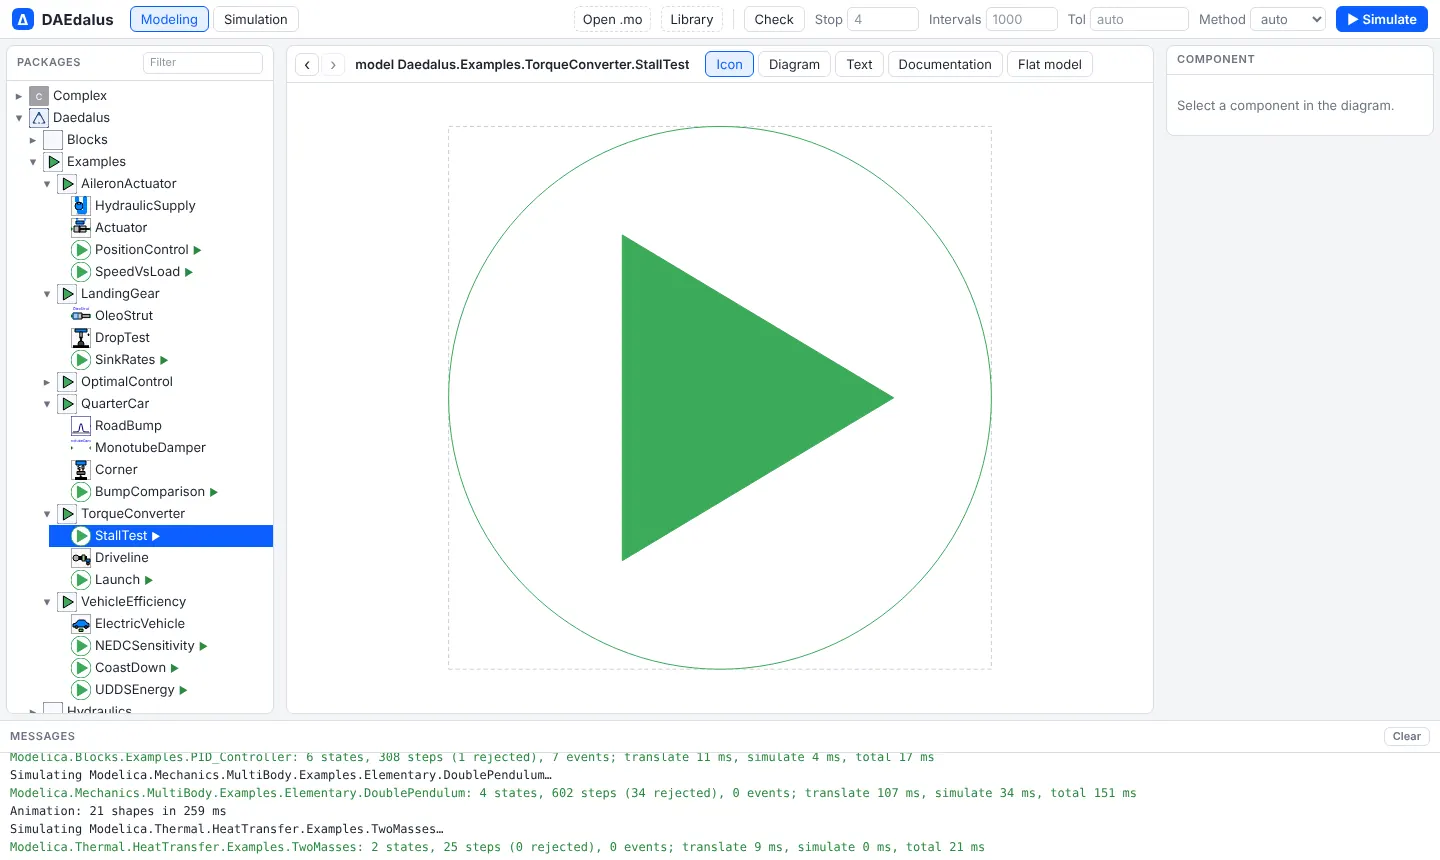
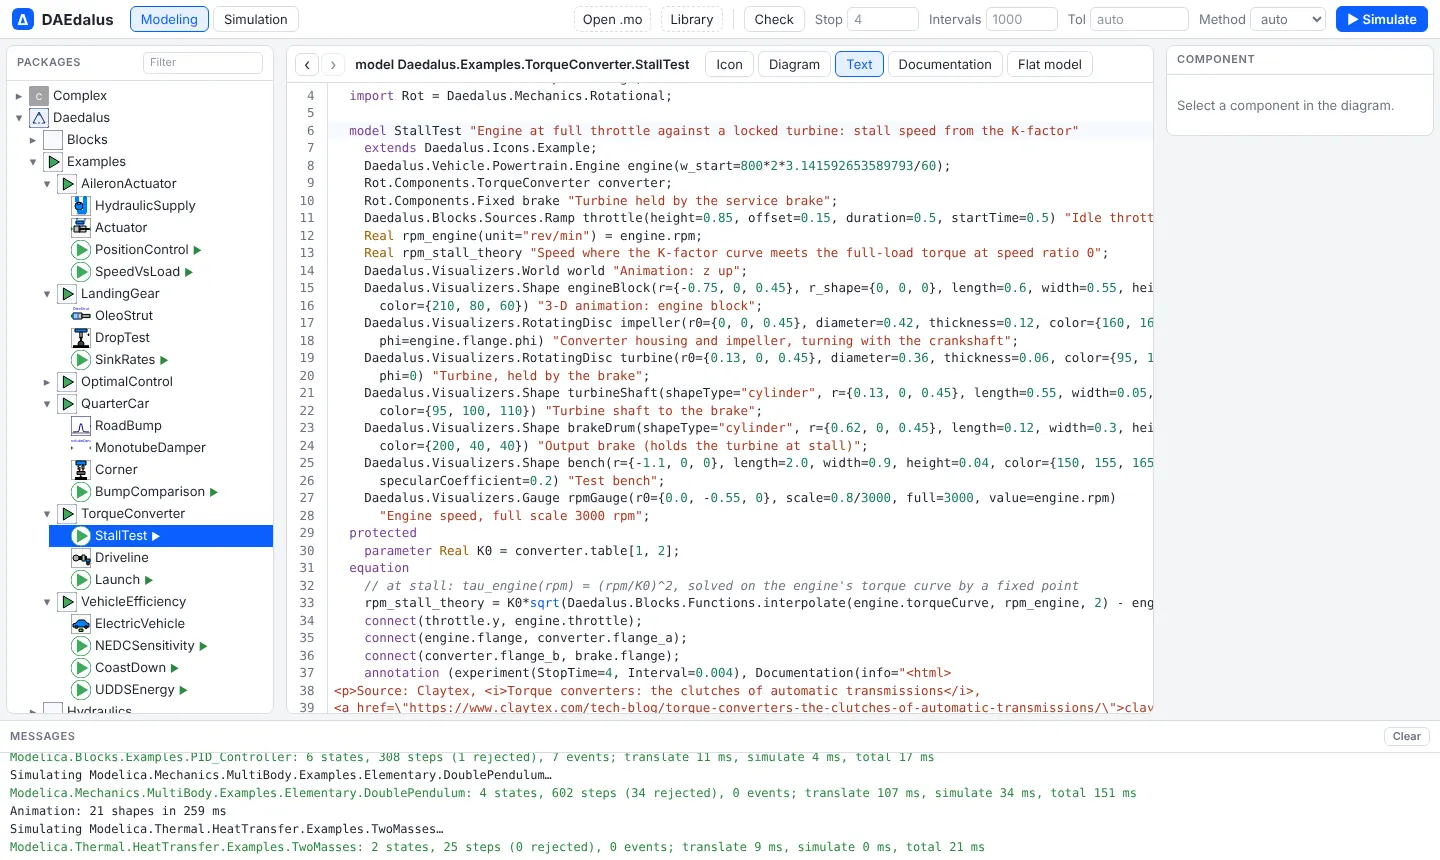
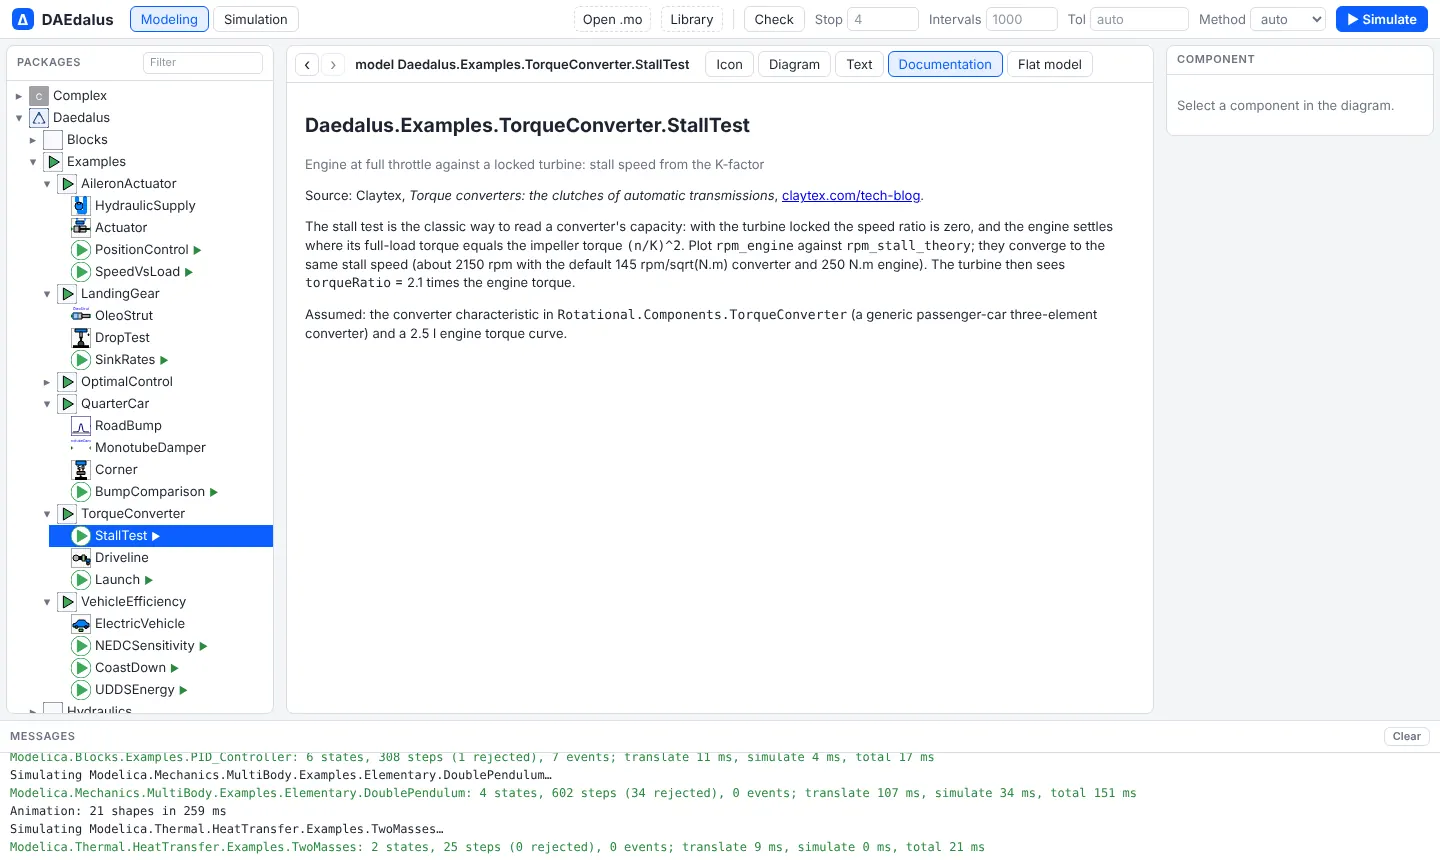
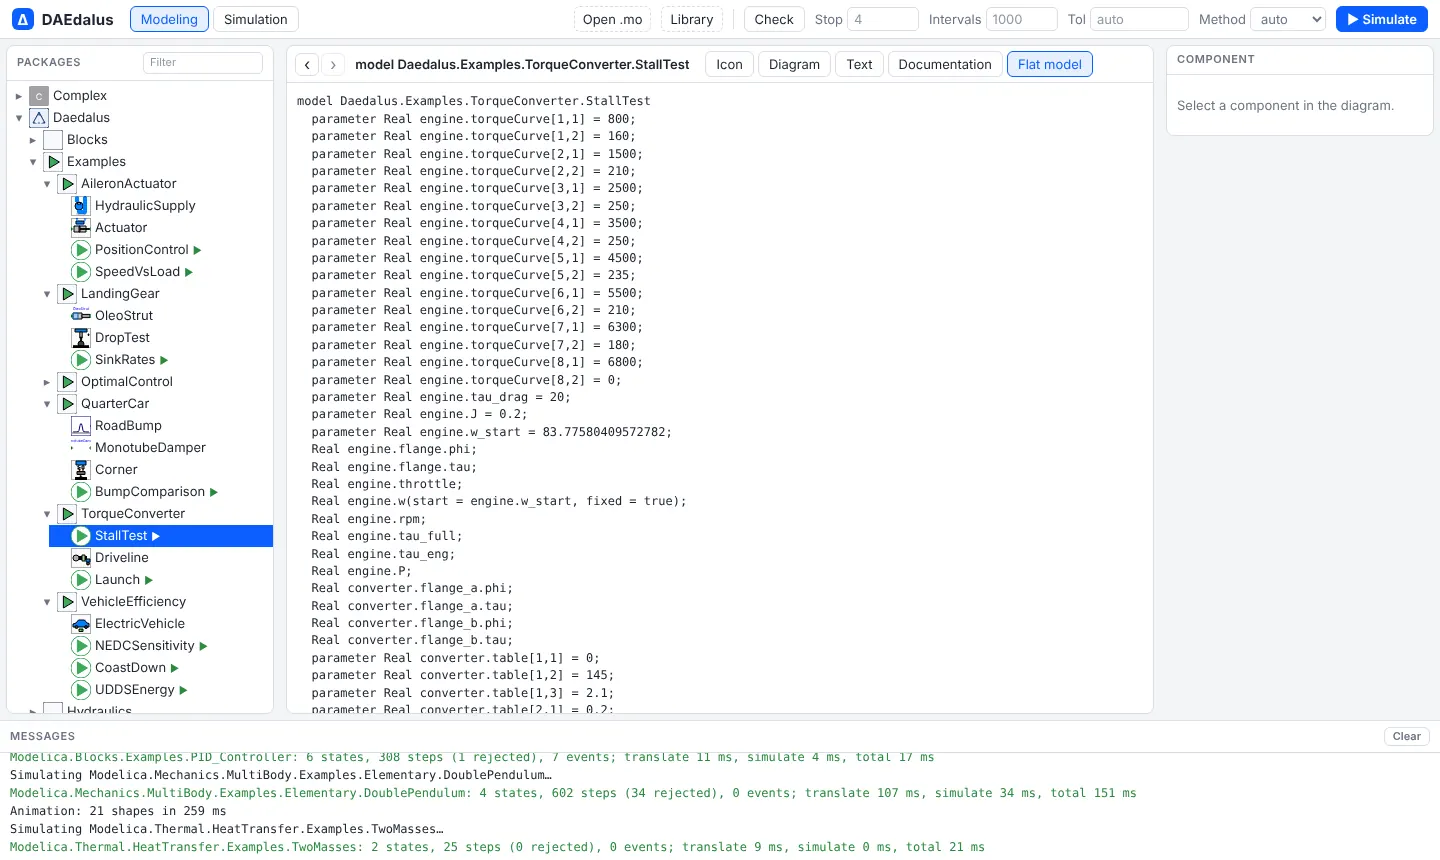
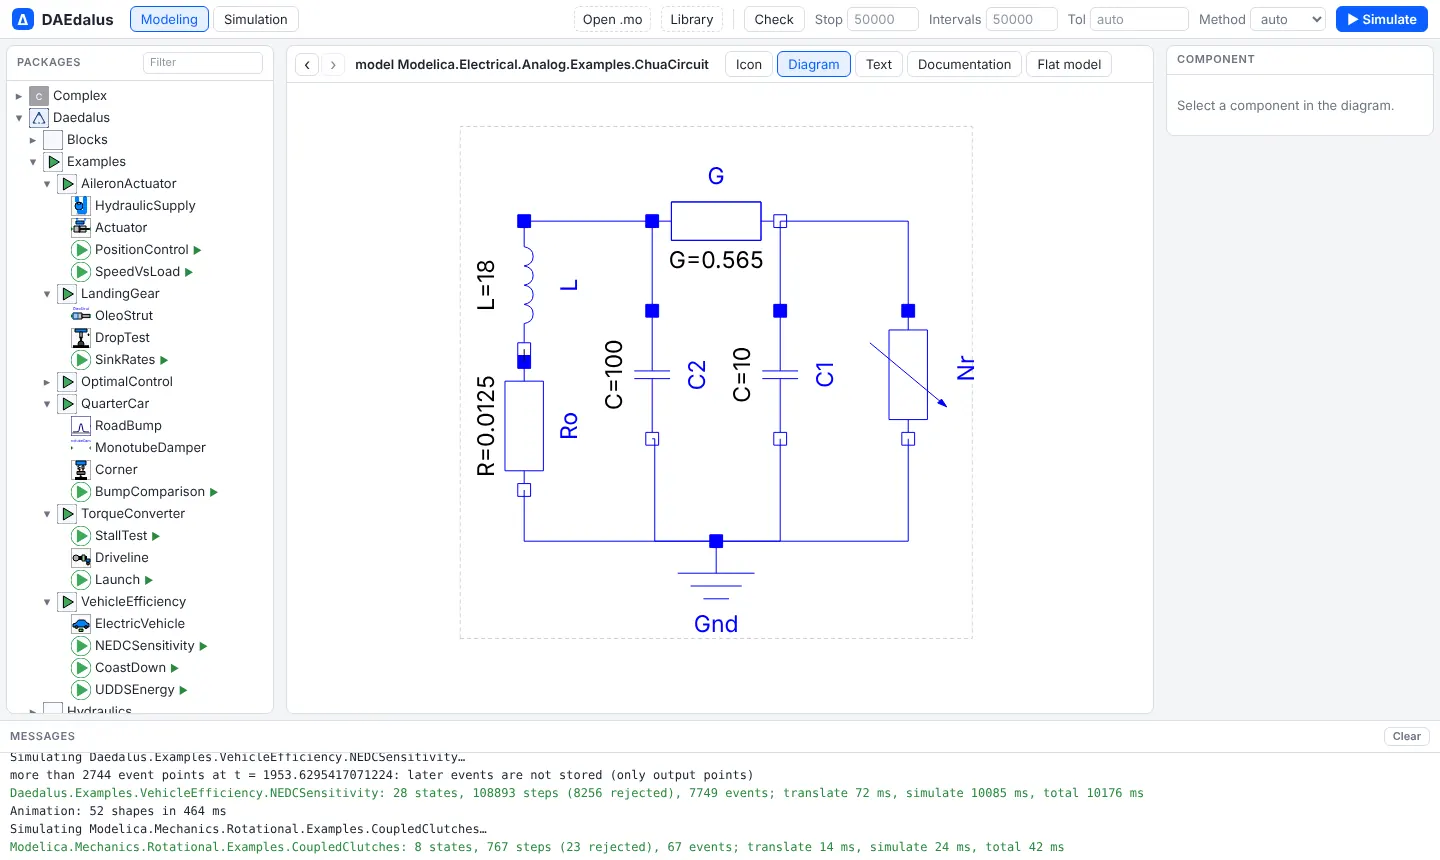
The Diagram view draws components, connections and graphics from their annotations, with zoom and pan (wheel and drag). It works for the bundled library and for the MSL:
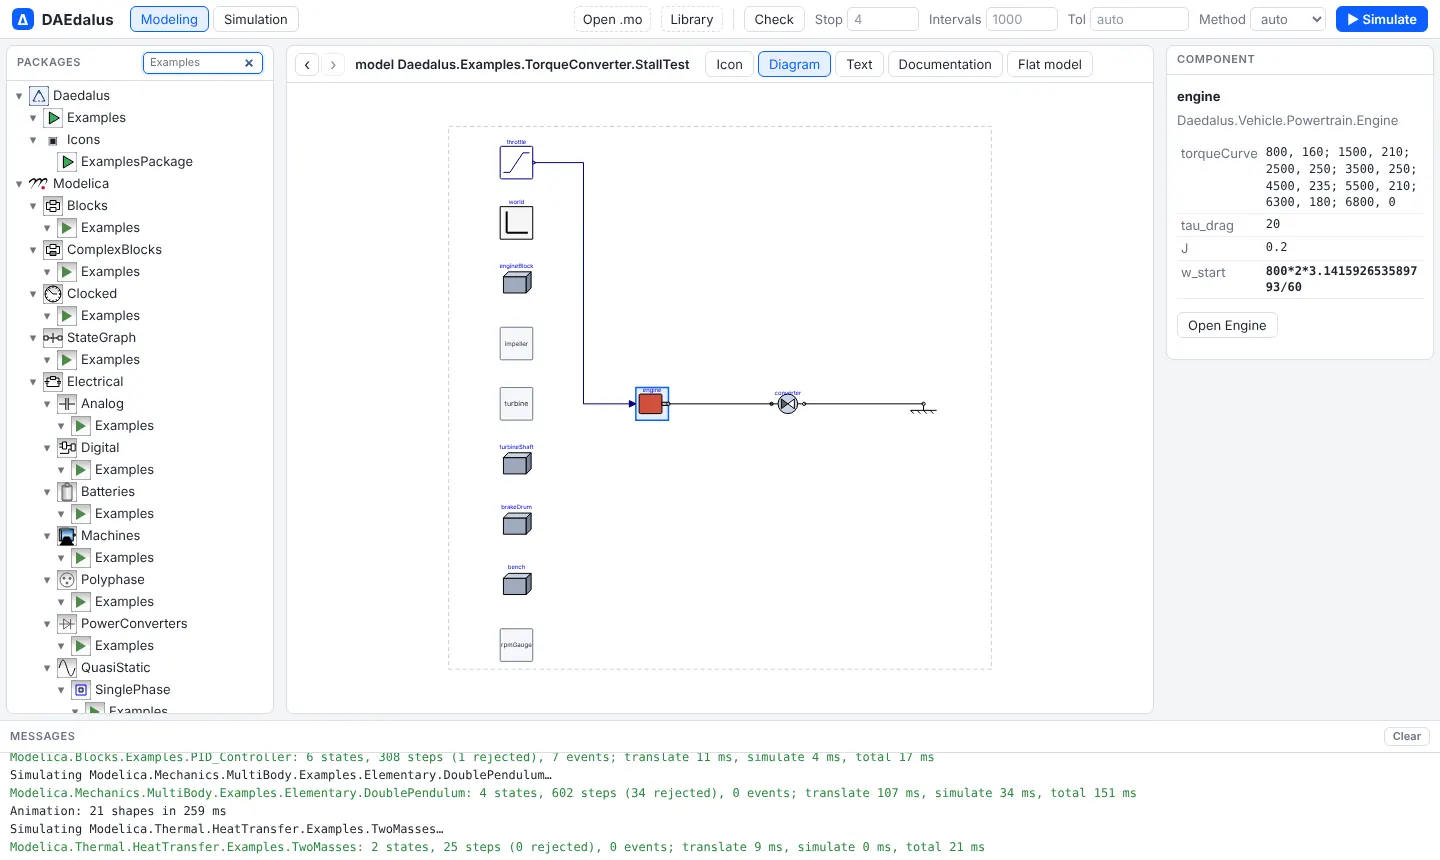
Filtering the package browser
Graphical editing
Classes in your own documents can be edited in the Diagram view. The bundled Daedalus
library and the MSL are read-only: Duplicate to my models copies the open class into
MyModels.mo, with every class name it uses written in full, and opens the copy.
New model adds an empty model there. MyModels.mo is kept in the browser. The
editor's Save .mo downloads that file; the toolbar's Save .zip downloads the
open model with the files and resources it needs.
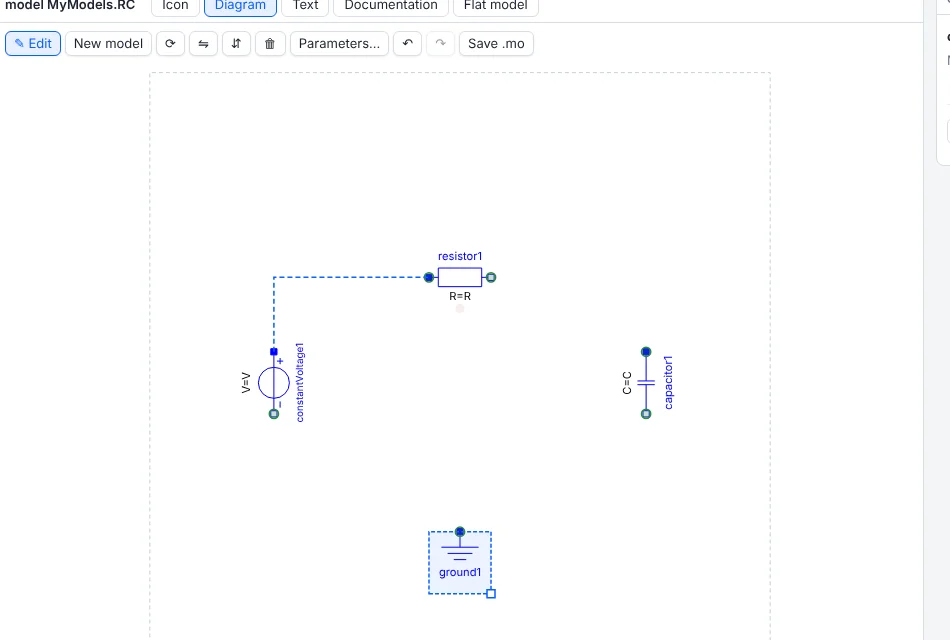
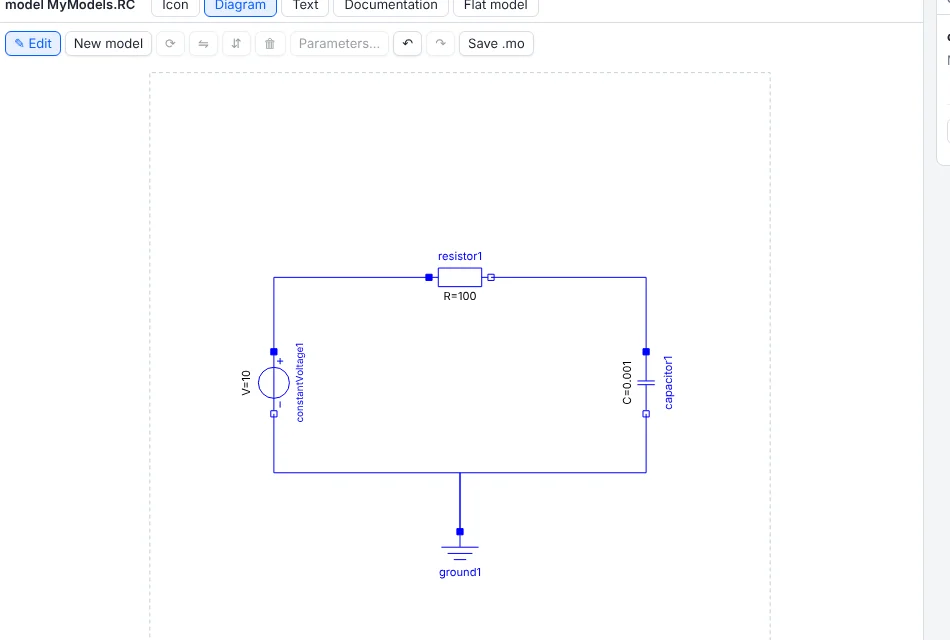
With ✎ Edit on:
- drag a class from the package browser onto the diagram to add a component;
- click or rubber-band to select, Shift to add, drag to move, arrow keys to nudge;
- R rotates by 90°, H and V flip, Del deletes components with their connections, and the corner handle resizes;
- drag from one connector to another to connect. Compatible connectors (same class,
same members, or one family such as
RealOutput/RealInputorPositivePin/NegativePin) light up, and the line is routed orthogonally; - double-click a component for its parameters: name, value, unit, description and the class default. Values are written as modifiers, and emptying a field removes one;
- Ctrl+Z and Ctrl+Y undo and redo.
Each gesture edits only the tokens it has to, so comments, layout and other annotations in the source stay as written, and the Text view, Check and Simulate use the edited text at once.
Simulation and the variable browser
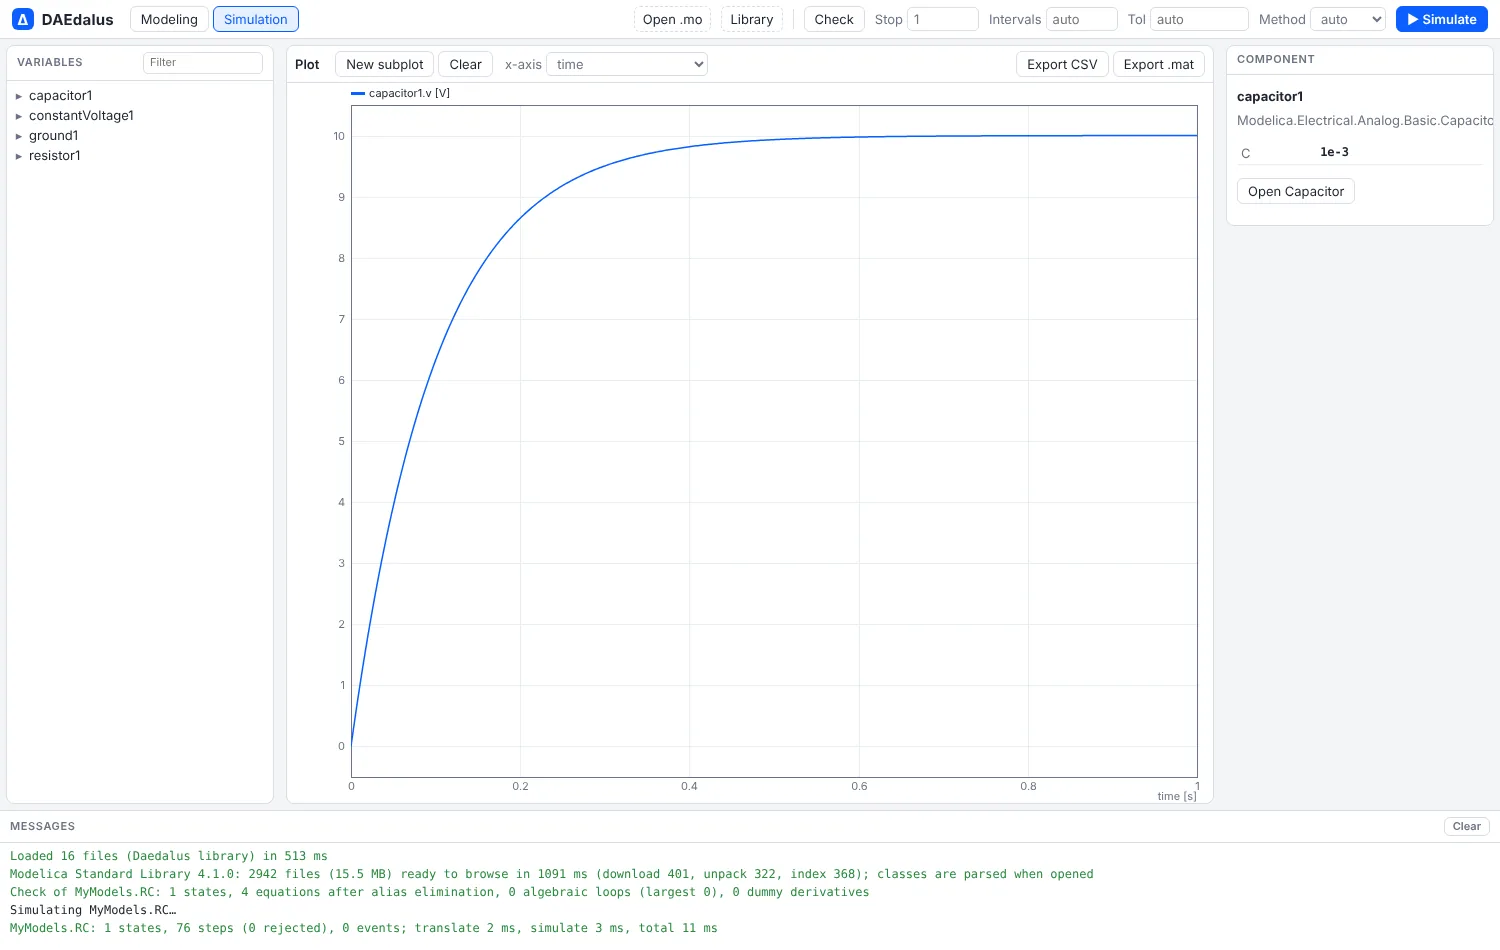
▶ Simulate compiles the model in the worker and switches to Simulation mode. The left pane becomes the variable browser: the result's component tree, with each variable's value at the end of the run and its display unit. Typing in the filter keeps the matching variables. Ticking a variable plots it.
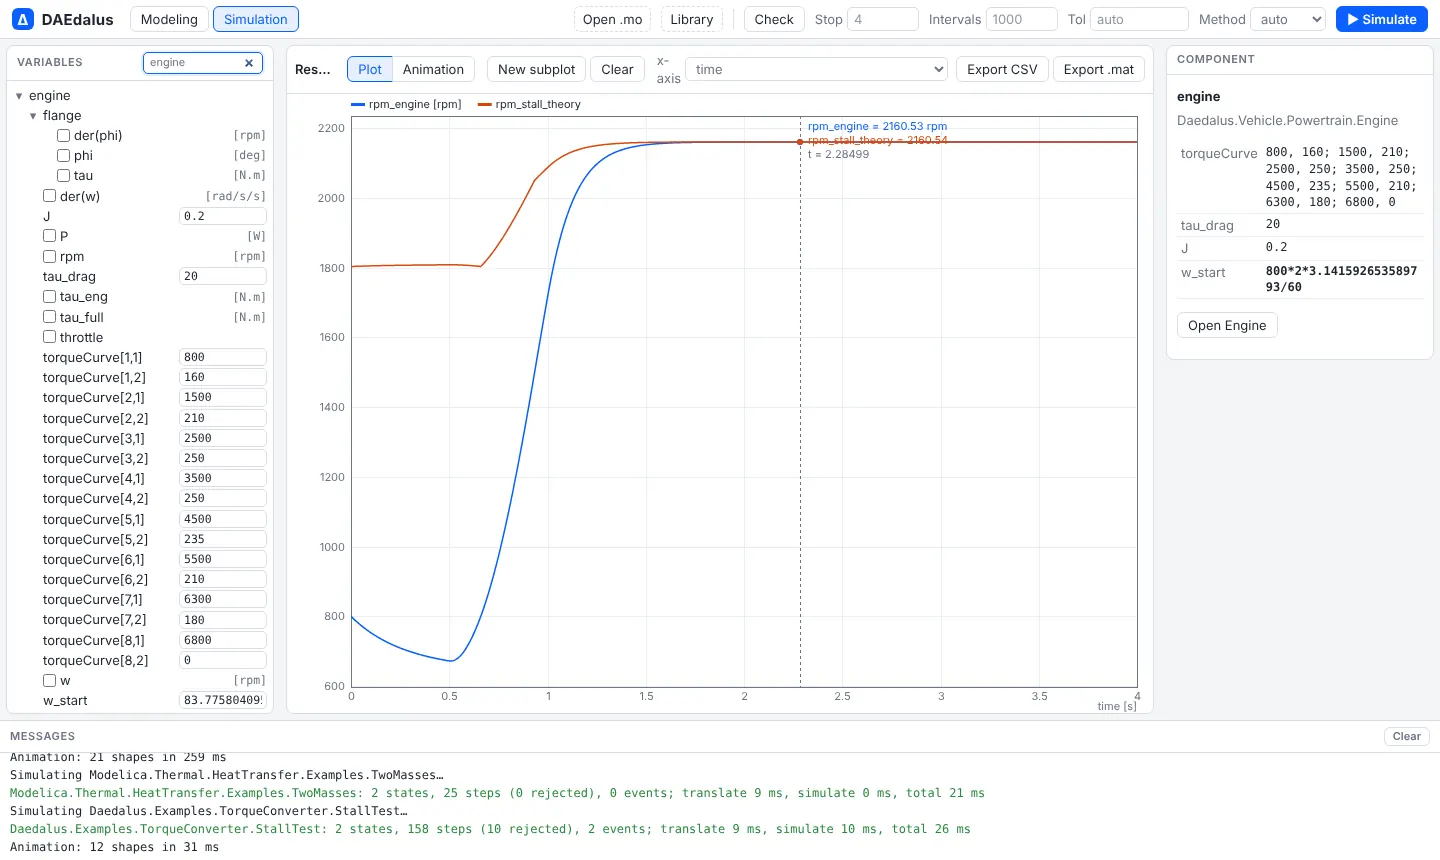
Parameters are editable in the variable browser: change a value and simulate again, and the run uses the new value without touching the source. Overrides belong to the model they were made on and are cleared when you open another class.
Simulating the same model again reuses its translation when only parameters or run settings changed, so the second run starts at once. Any edit to a source translates it again.
Speed: compiled tapes and the local engine
The equations run as compiled code, not through an interpreter: each model's hot tapes (derivatives, outputs, zero crossings and algebraic loops) become a small WebAssembly module that the browser compiles to machine code. Multibody models run about 1.5 to 2 times faster this way. The results are bit for bit the same as interpreting the tapes.
Local engine goes further on a desktop. Start the engine that ships with the command line tool:
daedalus serveIt prints a one-time token. Press Local engine in the toolbar and paste that token
(it is remembered next to the engine address). Simulations, analyses and experiment runs then
go to the native process on your computer, which is faster again than the browser, uses
every core for experiments and has no 4 GB memory limit. The class tree, diagrams and
editing stay in the page, and every document and library you load is sent to the engine,
so both always see the same sources. It gives the same numbers as daedalus simulate.
The button shows the number of cores when it is connected; press it again to go back to
the browser. The choice is remembered, and ?engine=URL connects to another address.
The hosted page's content security policy allows that connection (any http: or https:
URL), including a daedalus serve --port other than 7878.
The engine listens on 127.0.0.1 only (port 7878, --port to change it). A browser may
call it only from this site or from localhost (--allow-origin ORIGIN adds another),
and every request needs the token as Authorization: Bearer. Your models stay on your
computer either way.
Plots
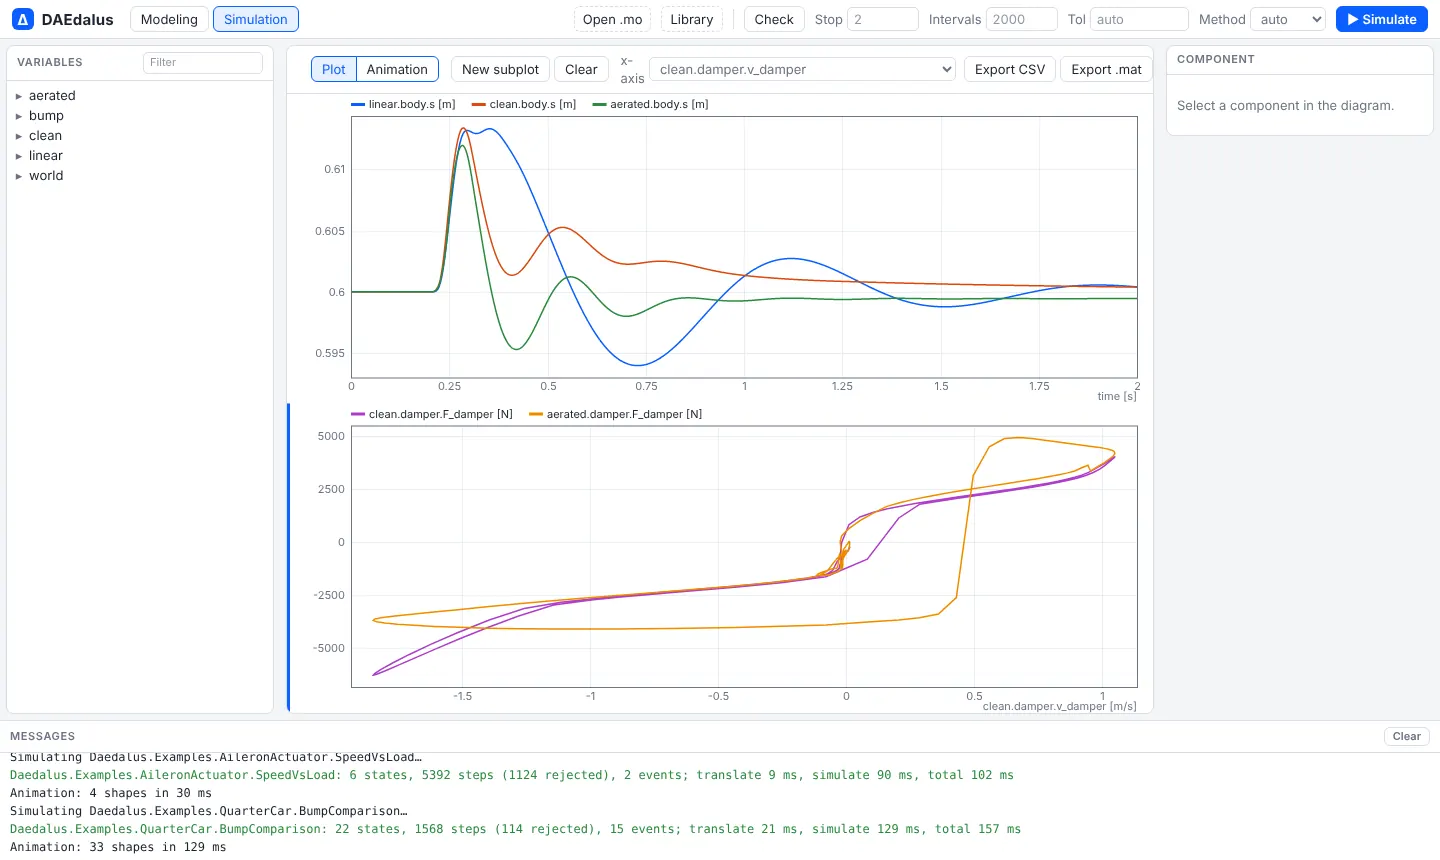
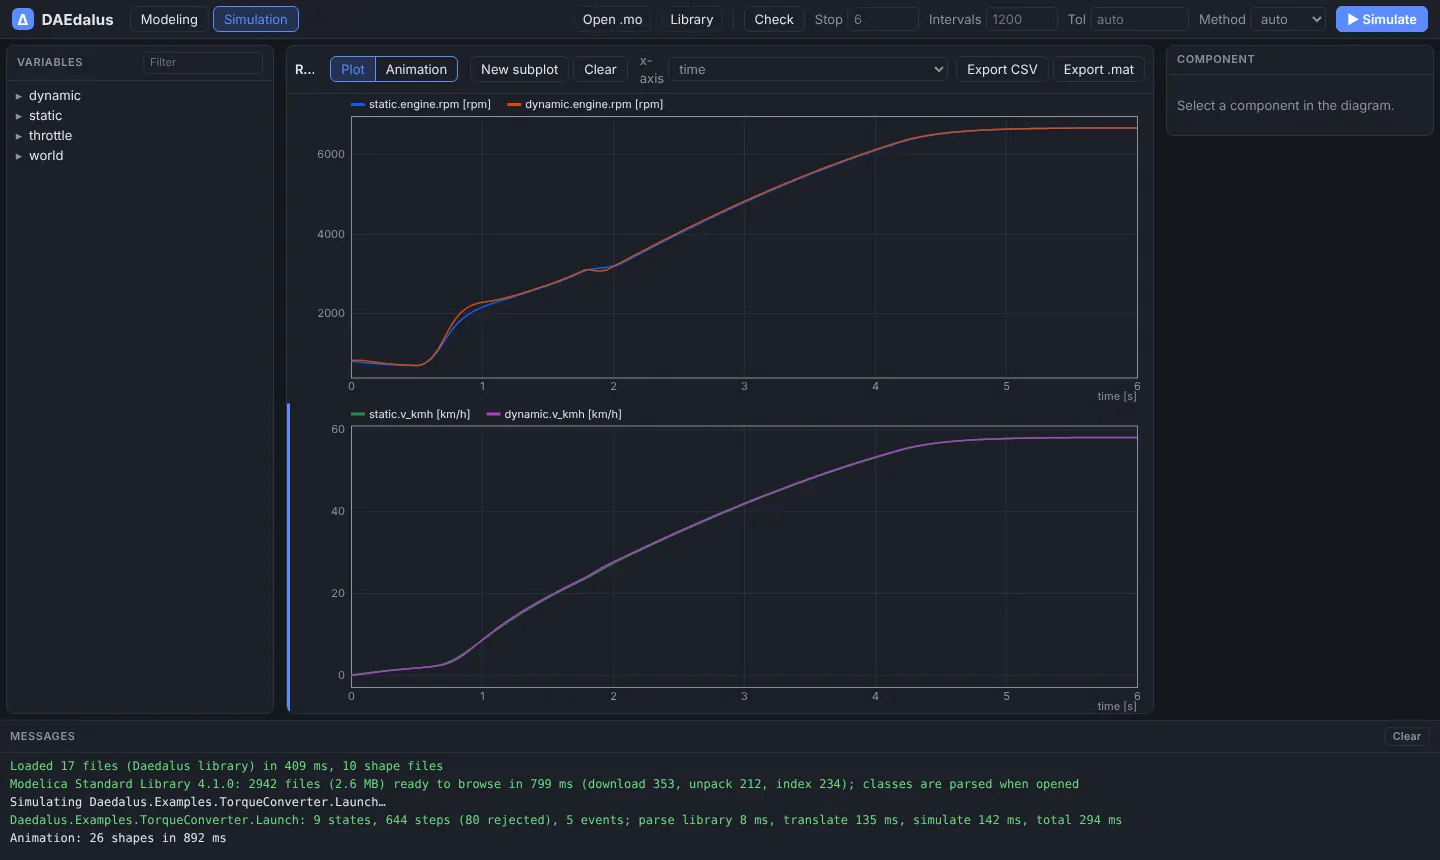
The plot window draws thousands of points per series smoothly and has:
- Display units, as in Dymola:
rad/sshows asrpm,radasdeg,Paasbar,KasdegC,m3/sasl/minandJaskJ; - subplots (New subplot) that share the time axis and zoom together;
- parametric plots: choose a variable as the x-axis of a subplot to plot one variable against another, such as a damper's force against its velocity;
- a crosshair readout of every series under the mouse, and drag-to-zoom;
- Export CSV and Export .mat of the plotted variables.
Structure, analysis and experiments
The Structure tab next to Flat model shows the equation structure, state selection and Jacobian (Structure and state selection). Analysis in the toolbar runs sensitivities, Monte Carlo, calibration and optimization (Sensitivity, uncertainty and calibration). Every run is kept in the Runs pane for overlays, differences, sweeps and share links (Experiments), and Profile adds a Performance tab (Performance analyzer). ✦ Assistant opens a chat that can use all of these (AI assistant).
Animation
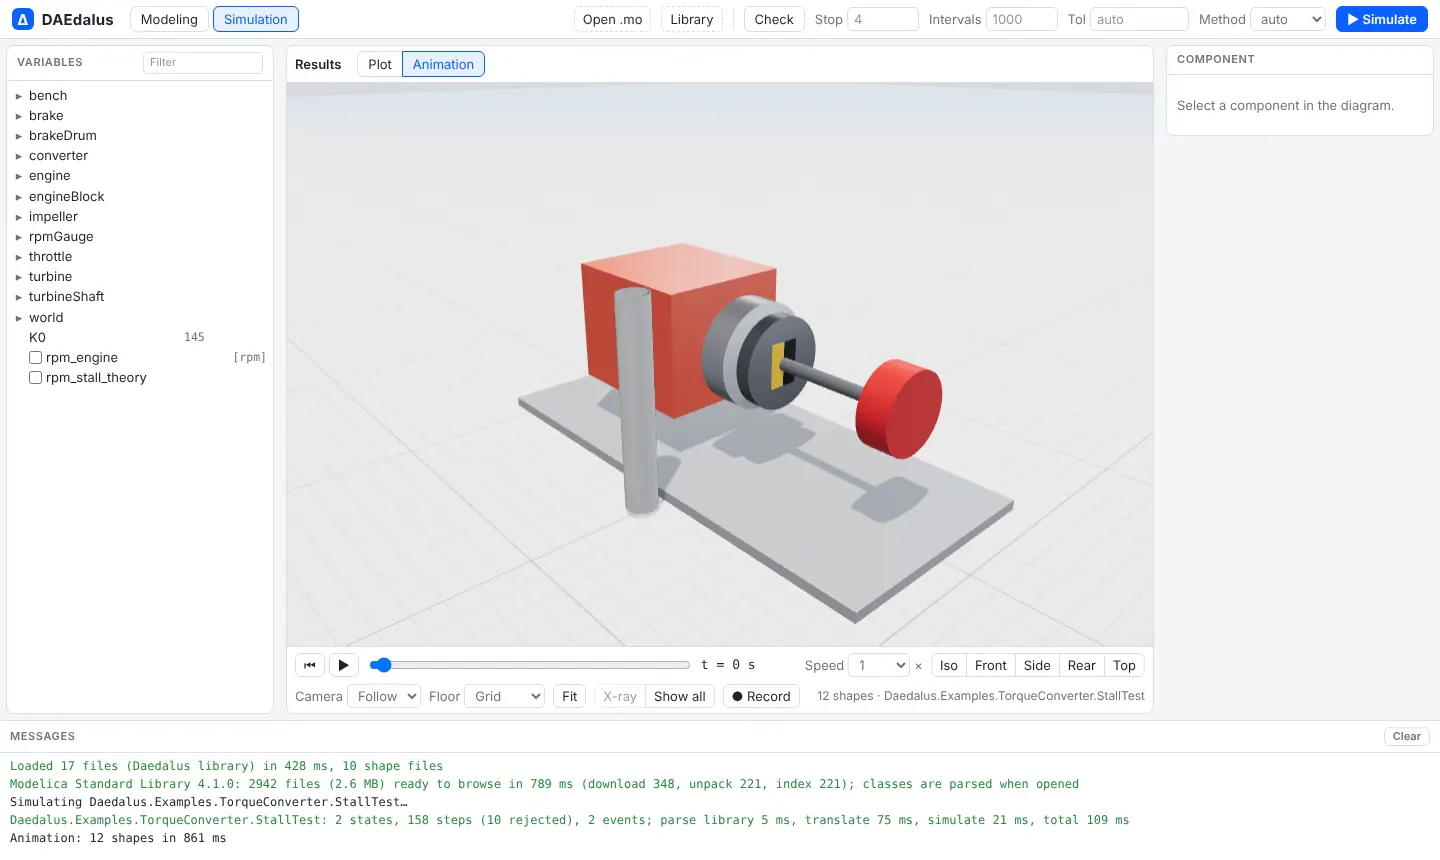
Models that contain MultiBody shapes, or the visualizers of the bundled examples, open in the Animation view after a simulation. See 3-D animation.
Dark mode
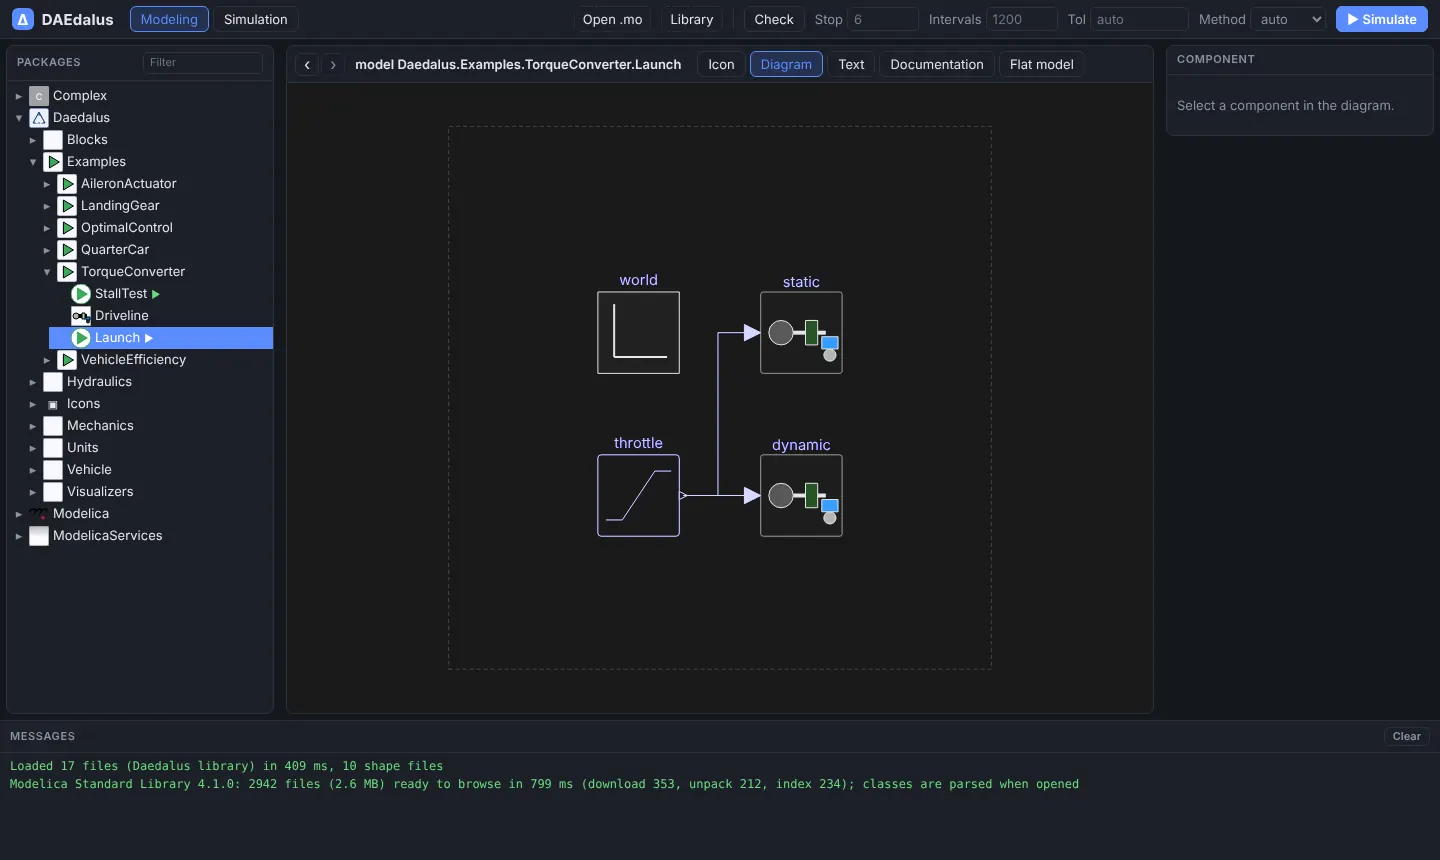
The workbench follows the system's light or dark theme. In dark mode the diagram sheet is dark, with a grid in both themes. Near-black default strokes and text follow the sheet so they stay visible, and stay dark when they sit on a light fill. Explicit library colours are left as drawn.
Navigation and links
Each class you open is a browser history entry with its own address, /# followed by the
class name. Back and Forward, Alt+← and Alt+→, the mouse side buttons and the arrows next
to the class name walk through them. A link to /#Some.Class opens that class, including
MSL classes, which open once the library has loaded. Every example on these pages links to
its model this way.
How loading works
The page loads the bundled Daedalus library, then downloads the MSL bundle (about
2.6 MB, 14.8 MB unpacked) and unpacks it with DecompressionStream. A light token scan
outlines every file so the package browser can list the whole library within seconds; a
class is parsed only when it is opened, checked or simulated, together with the classes
it needs.