Live plots and dashboards
Results stream into the plot while a simulation runs. A dashboard of sliders and gauges can change parameters during the run without restarting it. The plot window itself has matrix layouts, expressions, FFTs and statistics.
In plain terms: a plot draws each result as a curve over time. A dashboard is a page of controls, such as sliders, that you can move while the model is still running.
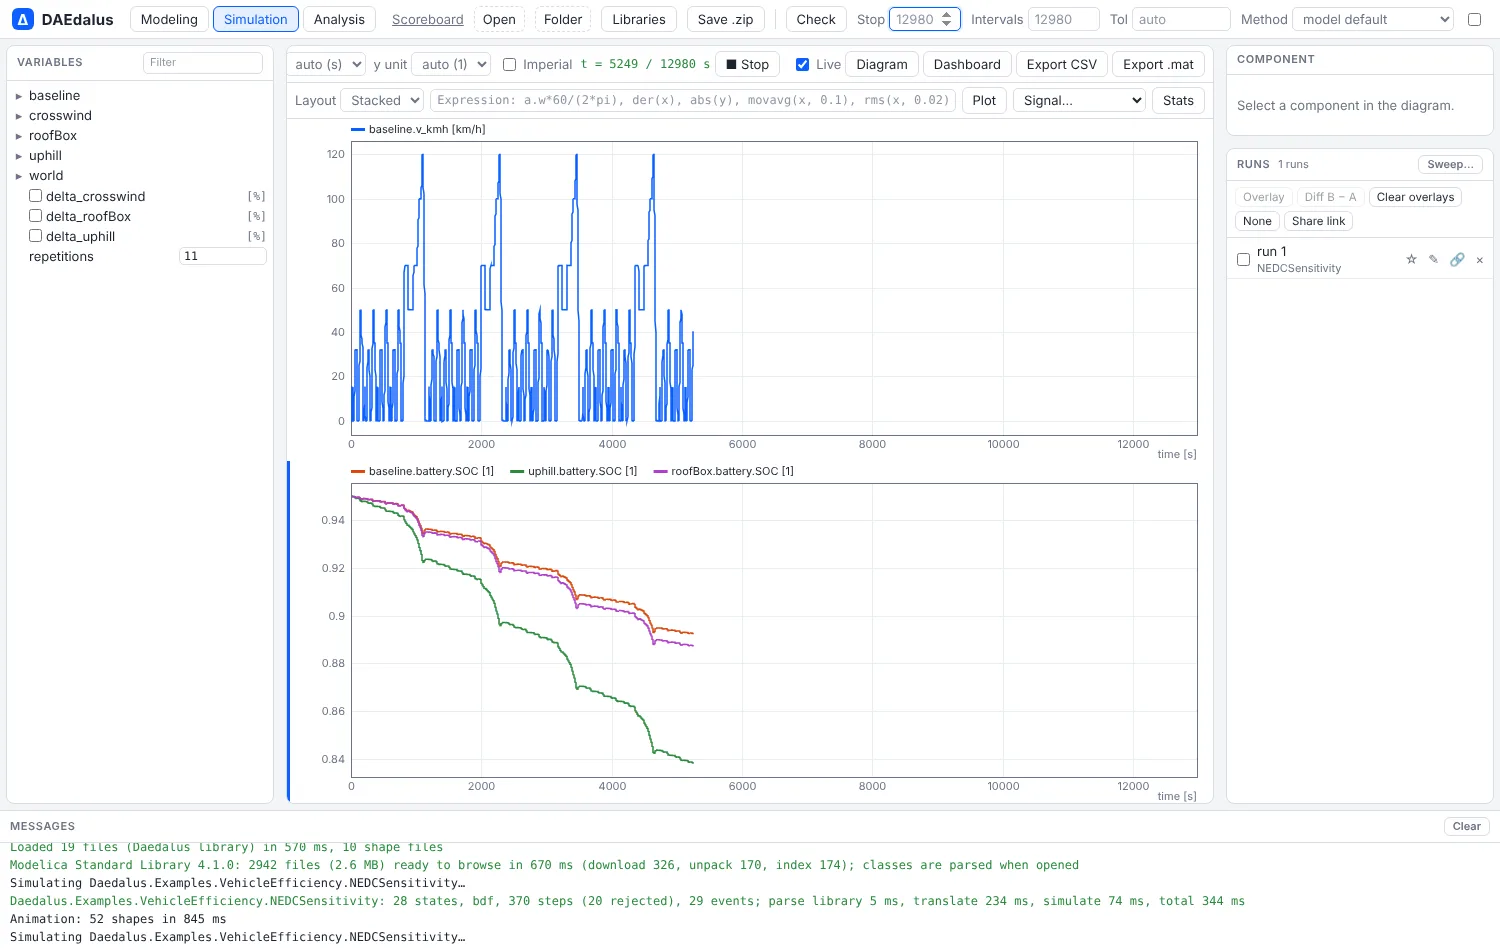
Live plotting
With Live ticked (the default), a simulation streams its rows into the plot as it runs, on a fixed time axis from start to stop time. ■ Stop ends the run and keeps the rows computed so far. The worker advances the run in slices of about 120 ms of wall-clock time. The solver takes exactly the steps of a run in one go, so the result is identical; only the plotted variables' new rows cross to the page after each slice.
Plots next to the diagram
Once a model has results, a plot strip below the diagram in the Modeling page shows the same plot as the Simulation page, and curves added in one appear in the other. Drag its top edge to resize it, or collapse it.
Click to plot. Click a component in the diagram to get a menu of its variables, first its own and then its connectors'. Click a connection to list the across and flow variables of both connectors.
Layouts, expressions and statistics
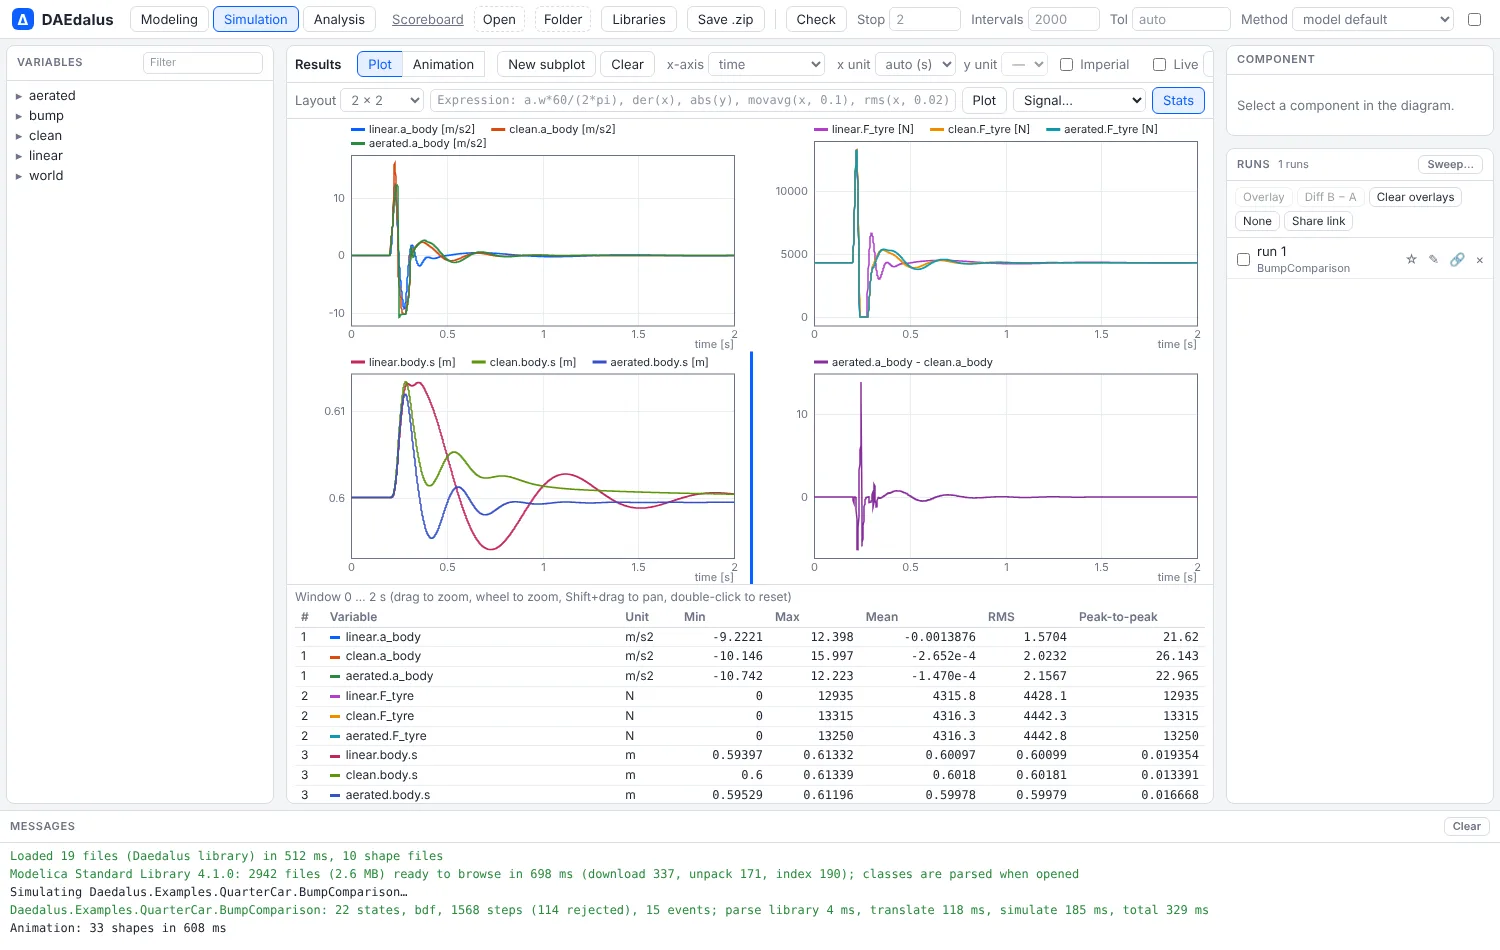
- Layout arranges the subplots in rows and columns, from 1 × 2 to 3 × 3. All time subplots share one time axis. Drag to zoom, use the wheel to zoom around the cursor, Shift+drag to pan and double-click to reset. The cursor readout shows the same time in every subplot.
- Expressions. The expression field plots a formula over result variables, evaluated
again after every run. Examples are
inertia.w*60/(2*pi),abs(a - b),der(x),integral(x),movavg(x, T)andrms(x, T).min,max,pow,atan2, the usual elementary functions,pi,eandtimealso work. - FFT.
fft(x)plots the amplitude spectrum of the visible time window in a frequency subplot. The spectrum shows how strong each frequency in the signal is. The window is resampled uniformly to a power of two, with a Hann window (a smooth taper that reduces the leakage of strong frequencies into the rest of the spectrum, at the cost of some sharpness). - Signal… applies one of these operators to every variable of the active subplot.
- Stats shows the min, max, time-weighted mean, RMS and peak-to-peak of every curve over the visible window, and updates as you zoom. The time-weighted mean counts each value by how long it lasts, and RMS (root mean square) is the typical size of a signal that swings above and below zero.
- Units: each axis can be shown in any unit its quantity converts to, and Imperial switches the defaults; see Unit checking.
Dashboards
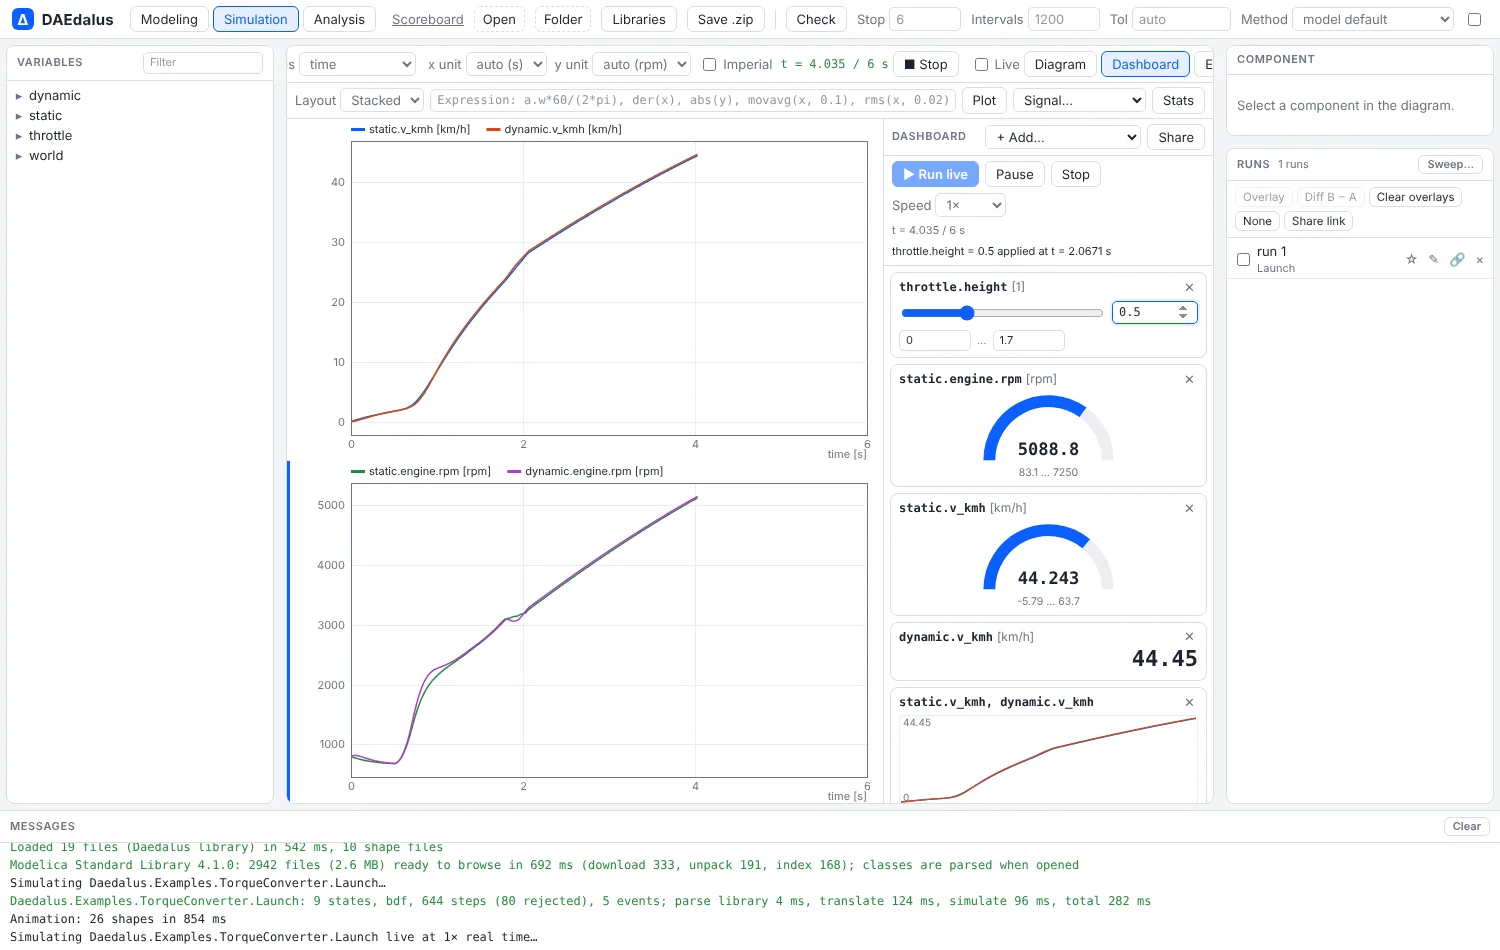
Dashboard opens a panel of widgets bound to the open model: sliders on free Real parameters, gauges, numeric displays and mini plots of variables.
- Run live paces the simulation against wall-clock time, from 0.1× to 200×. Pause, Stop and the speed apply during the run.
- Moving a slider during the run changes the parameter at the time reached, without restarting. Parameters bound to it are evaluated again, an event iteration settles the discrete variables, and the integrator restarts from the current states. Only free Real parameters can change this way; others need a new run.
- A slider moved while nothing runs sets the value for the next run.
- Layouts are saved per model in the browser, and Share copies a link that opens the model with its dashboard.
How it works
sim::Incremental (advance(t, wall_budget), set_params, results, finish) is the
core of both live plotting and dashboards. crates/daedalus-core/tests/incremental.rs
checks three things: that budget slices reproduce a full run bit for bit, that time
slices see every event, and that mid-run parameter changes propagate.
web/scripts/e2e-plotting.mjs exercises the plot features in Chromium.